
Self-Reflected
Complex artistic rendition of the human brain
Museum Exhibition, The Franklin Institute
National Science Foundation Research Project
2015 - 2016
Featured in
-
The Franklin Institute, Philadelphia, PA (permanent)
Role
Research Assistant - Design & Visualization
Context
Two-year art + neuroscience research project with Dr. Greg Dunn and Dr.Brian Edwards, at University of Pennsylvania
Collaborative work with 8 other artists, neuroscientists and engineers
Self-Reflected is a 300" x 200" gigantic complex visualization of the human brain neural network currently on exhibition at the Franklin Institute in Philadelphia.
This installation, led by Dr.Greg Dunn and Dr. Brian Edwards, uses a technique named "reflective micro-etching", creating a third dimension of information that can be used to create animation in a seemingly two dimensional surface.
OVERVIEW
This installation shows both macroscopic information transmission between brain regions, and microscopic structure of individual neurons.


The making of this project combined a complex array of hand drawing, scientific data, computer simulation, photolithography, gilding, and strategic lighting design.
As a design research assistant, I was responsible for communicating with neuroscience co-workers, translating biological information into different levels of visualization(individual neurons, neuron groups, and brain regions), and certain steps within physical fabrication.
THE MAKING
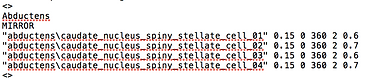
STEP 0 - Raw Data

STEP 1 - Individual Neuron Illustration


STEP 2 - Individual Neuron Digitalization
Featured Region 1
Basal Ganglia > Caudate Nucleus > Spiny Stellate Cell


"fairy - wand" shaped key with 10 continuous straight edges
used to indicate the directionality of soma for later computer graphics steps (region flood-filling)
STEP 3 - Regional Flood Filling


STEP 4 - Reflection Animation Coding

The rainbow gradient coloring embeds the sequence of information transmission: information travels from "red" to "purple" regions in human brain.
STEP 5 - Fabrication
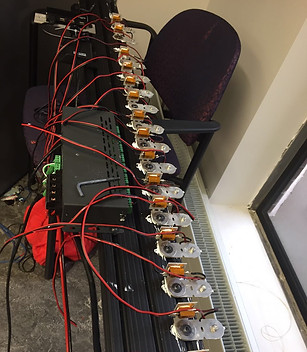
Assembling LED light arrays
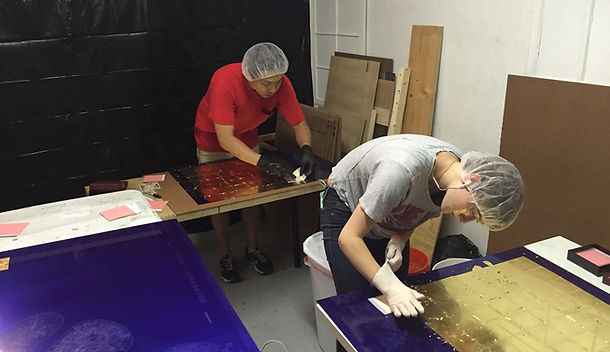
Applying gold leaves